Portal Overview
The SQLBench Web Portal is where you go to:
- View standard reports
- Create custom dashboards
- Configure alerts
- Activate agents
- Edit settings
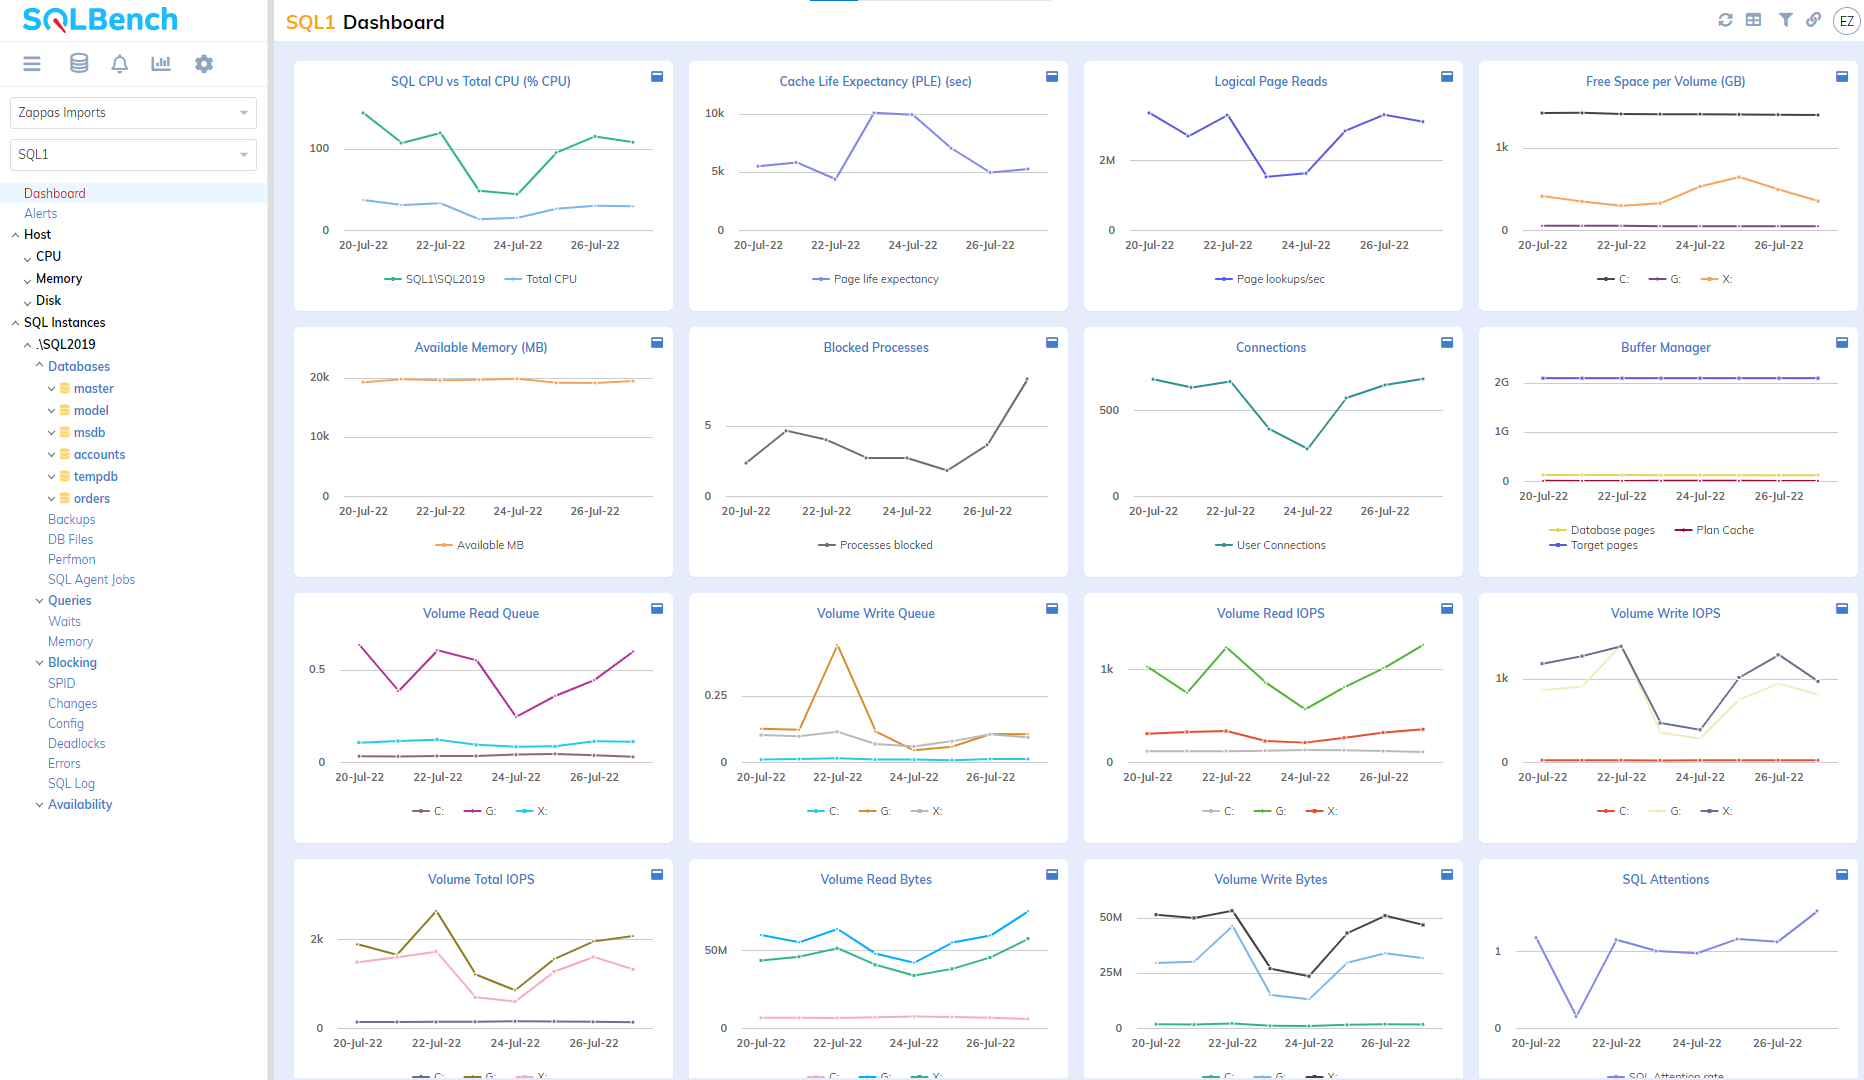
View standard reports
A wide range of standard telemetry reports are available in the SQLBench Web Portal.
After selecting an account and a server, a rich server dashboard is immediately displayed.
Click any graph to drill in further, or select another telemetry report from the left menu.
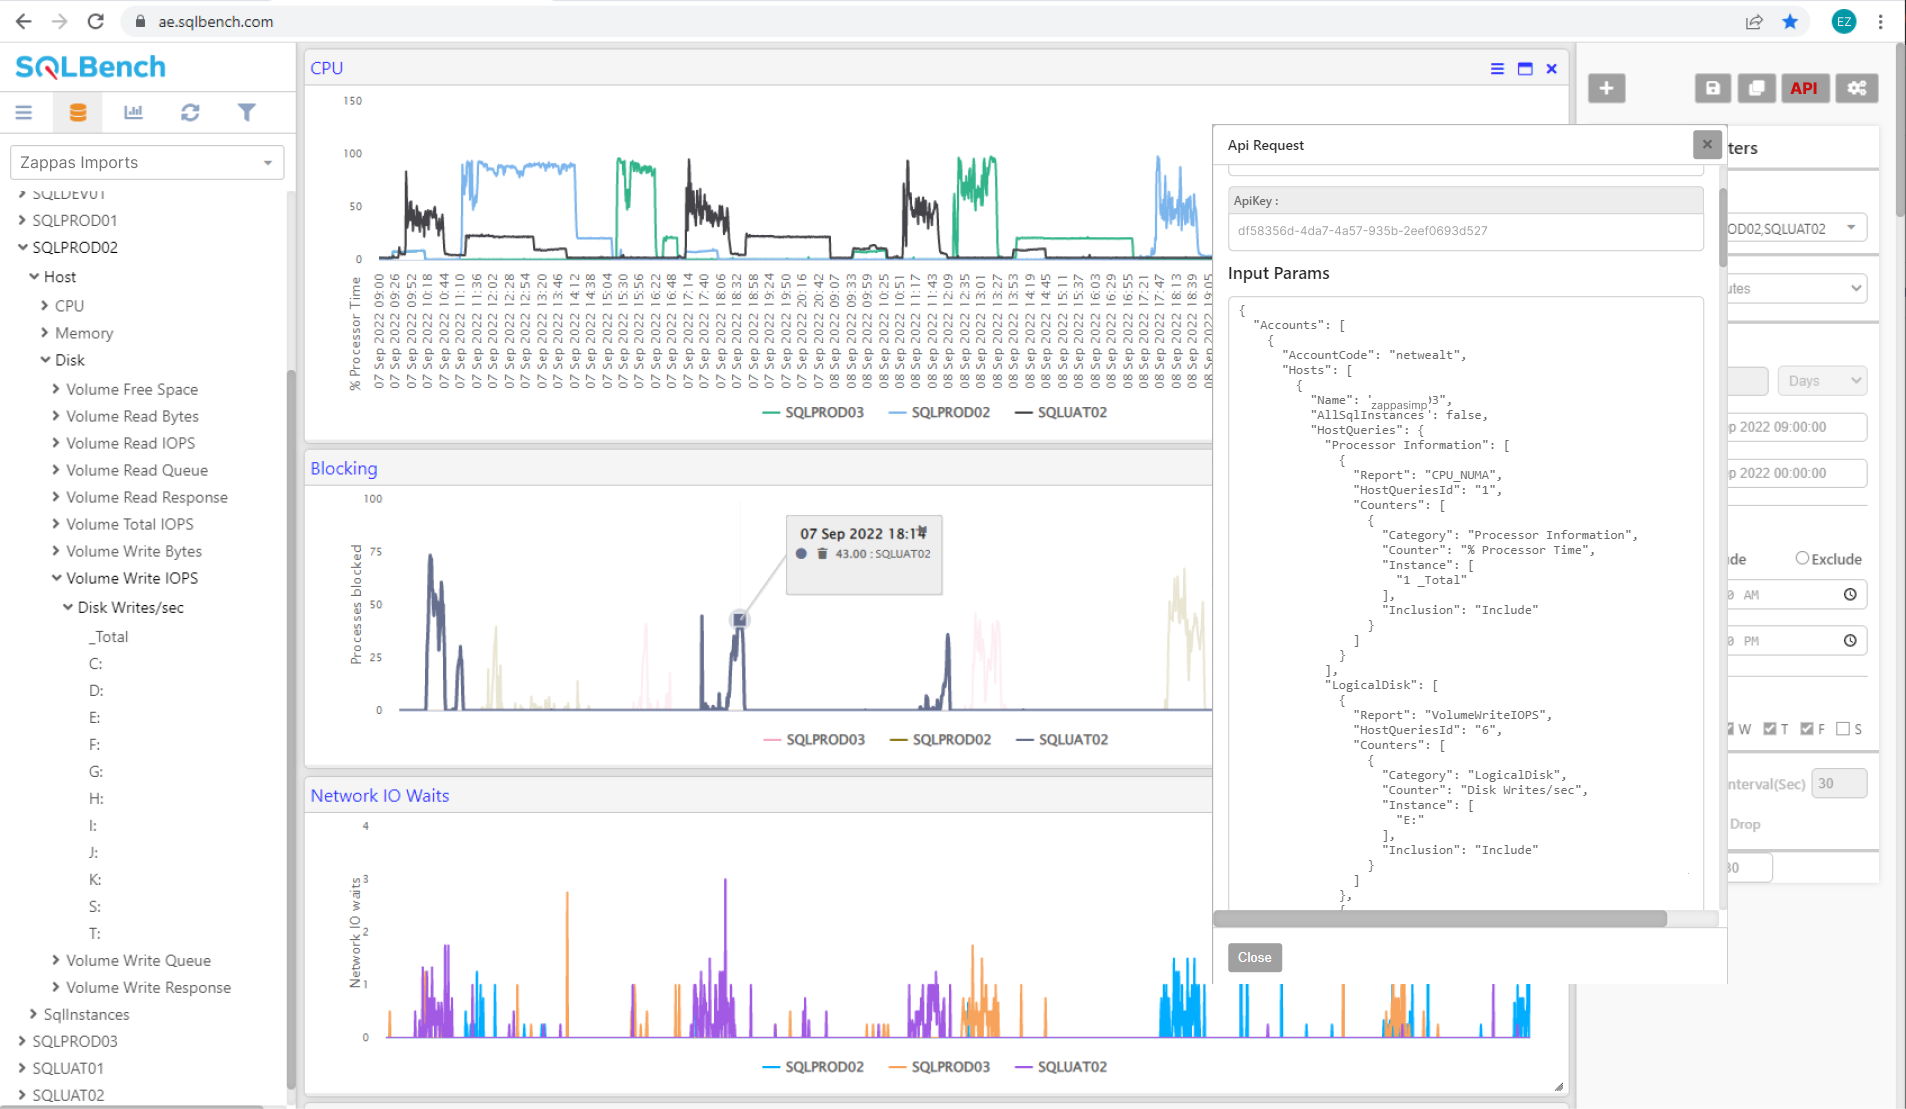
Create custom dashboards
Create rich, custom dashboards with our "API Explorer" dashboard tool.
Drag metrics from various sources, systems & even accounts into single charts.
Generate API expressions to source telemetry data for your own dashboarding platform.
Create complex dashboards with many charts & auto-refresh for operational observability.
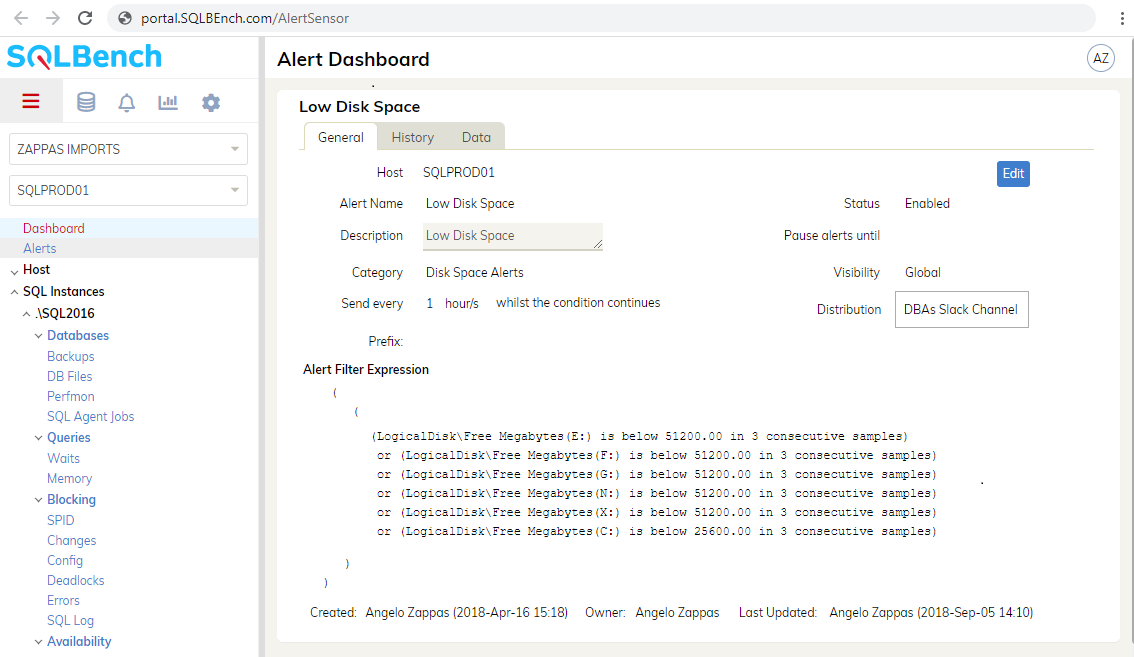
Configure alerts
SQLBench allows you to configure alerts on a wide range of Windows and SQL Server sensors.
Configure, share and subscribe to alerts in the SQLBench portal and deliver them to your inbox, the SQLBench Mobile Alerts App, Slack Channel or integrate with other alert platforms such as PagerDuty.
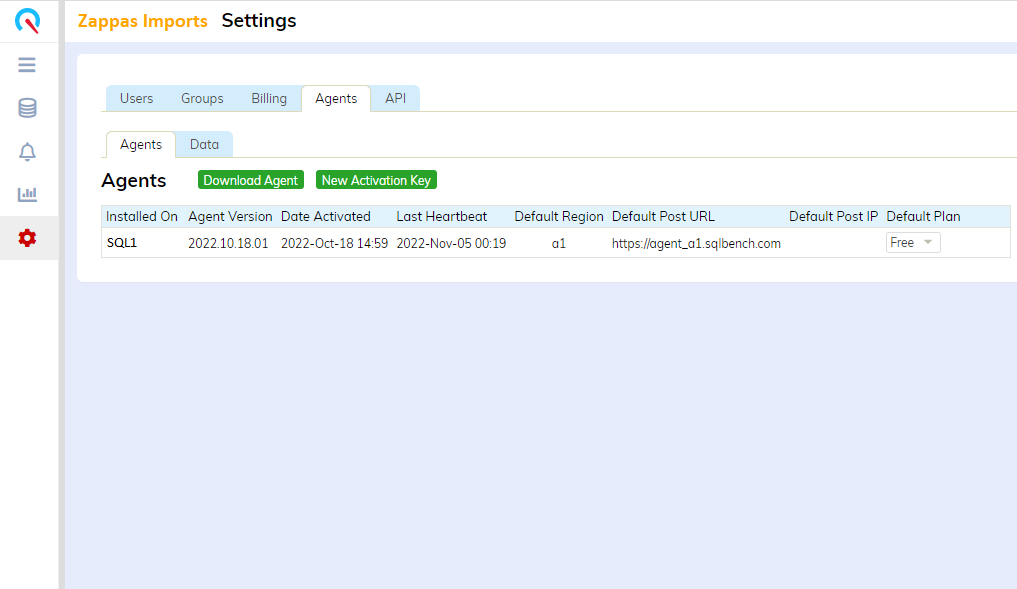
Activate Agents
When installing a new SQLBench Agent, select an account, click the settings cog icon and select the Agents tab.
Download the latest installer using the "Download Agent" button.
Generate a new activation key by clicking the "New Activation Key" button.
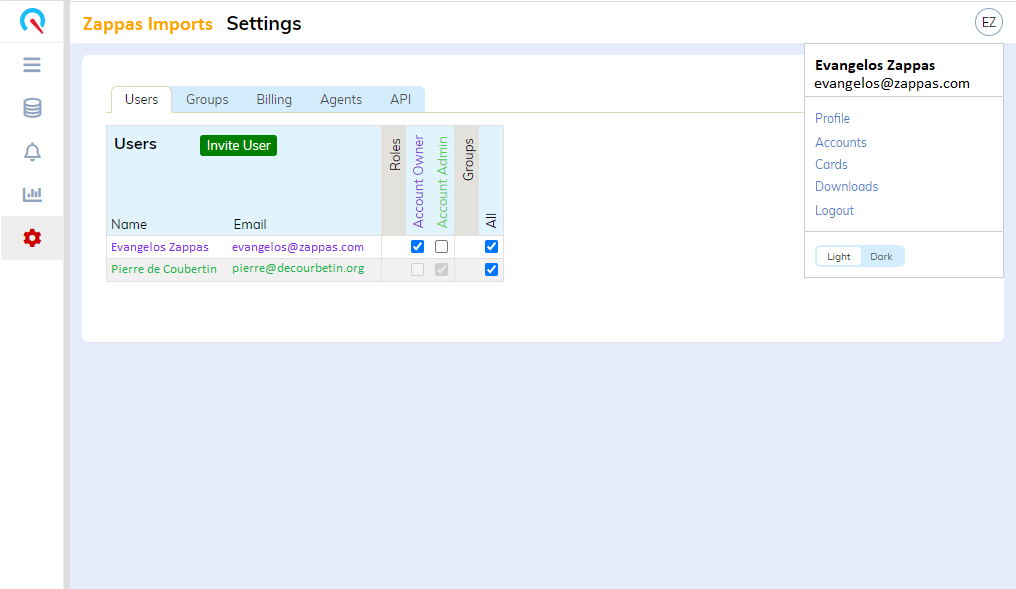
Configure Settings
Configure Account and User Profile settings from the SQLBench Web Portal.
User Profile settings are accessed by clicking the avatar located in the top right corner of every page.
Account settings are accessed by selecting an account from the left menu top drop down list, then clicking the settings cog icon in the left menu.